This is a small addition to the previous article about the debuggers.
The stdlib has 3 backends (cProfile and profile , hotshot) and countless 3rd party visualization tools, converters and whatnot. Where there are many tools there's plenty of bad advice ...
If you don't know what are you looking for, just use a visualization tool! *
There's so much advice to just roll out your own visualization tool, be it text using the Stats from stdlib or graphical using libraries like pycallgraph or gprof2dot the first reaction would be to actually start writing code to generate reports.
But this is a bad idea, you need to change that code to skew or drill down in the report and generally everything will be confusing if you're not looking for something specific. You will probably overlook that thing that is killing your performance.
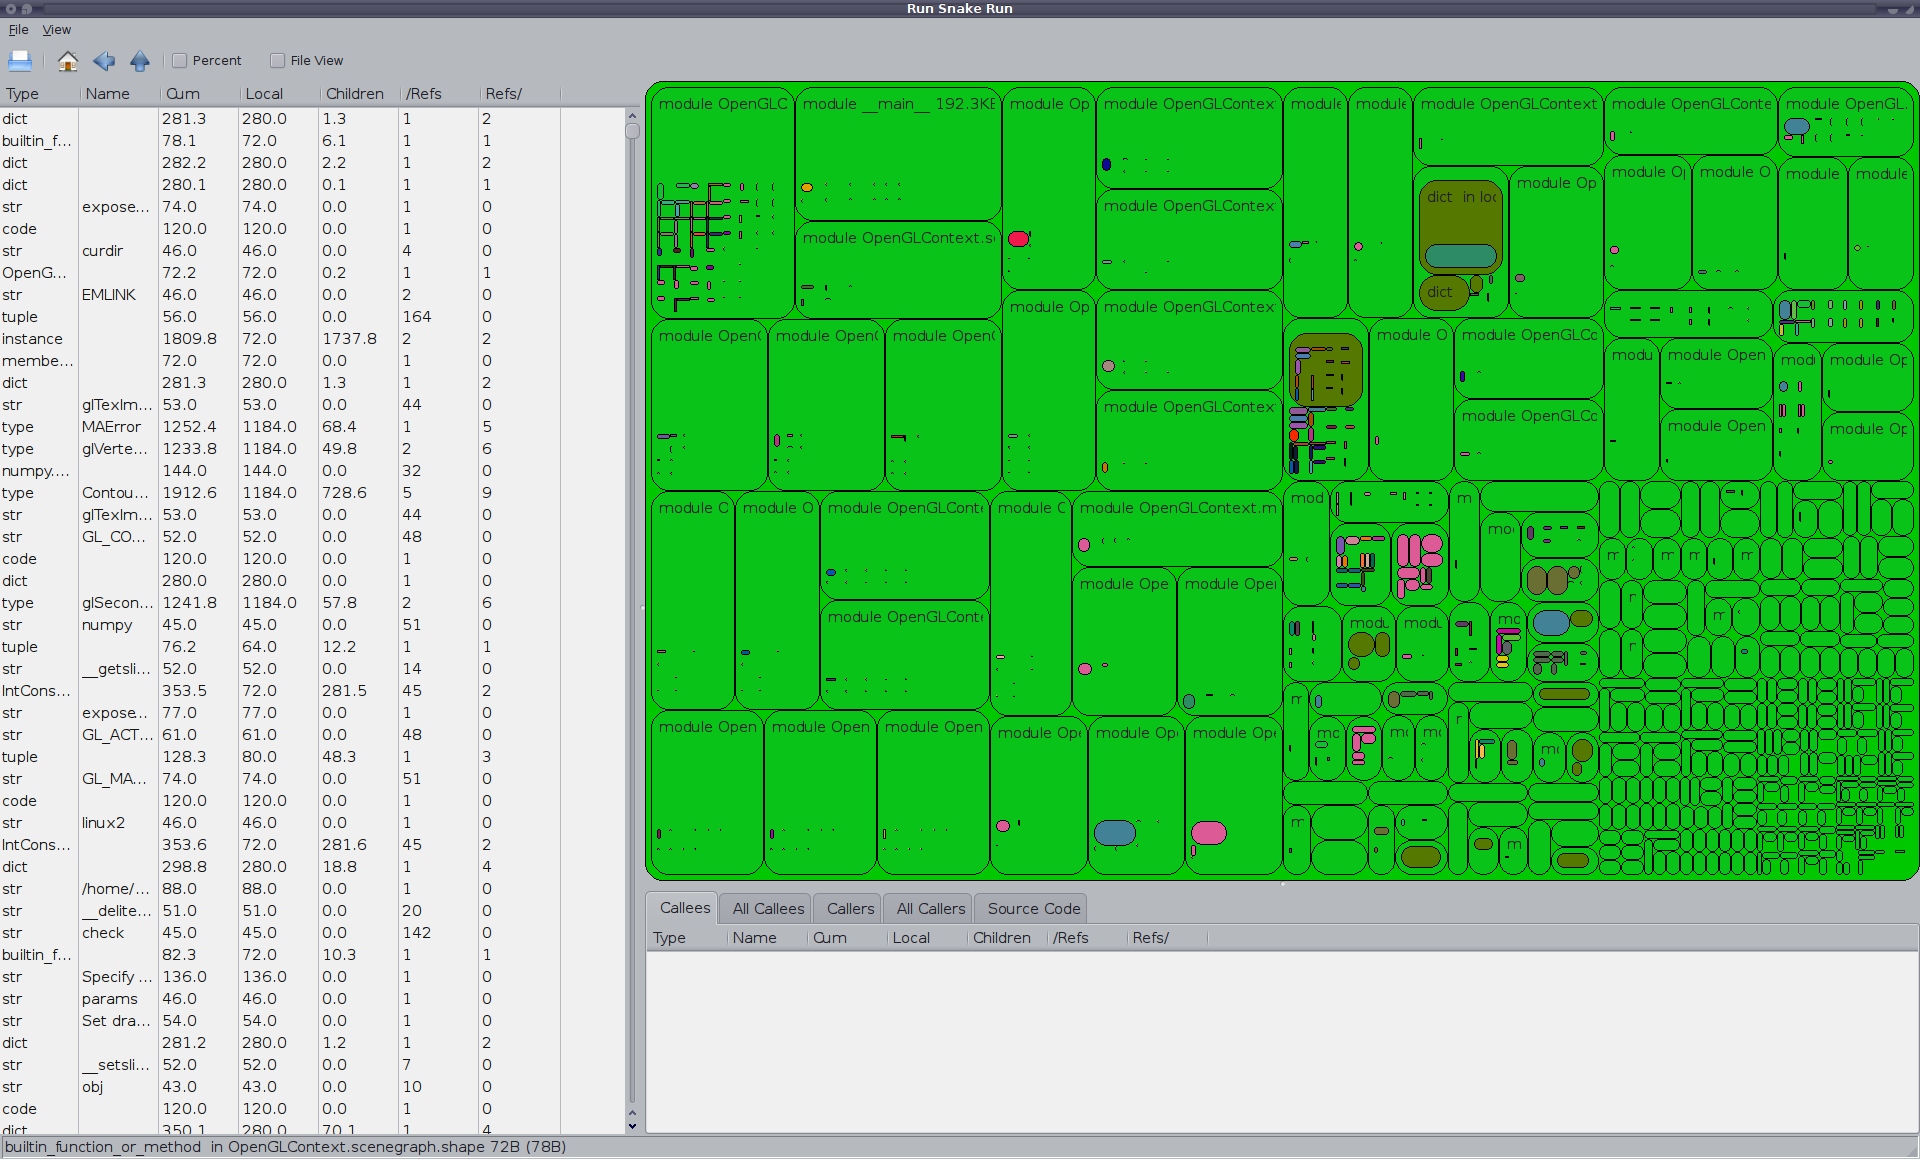
RunSnakeRun *
You can install it with pip install RunSnakeRun or apt-get install runsnakerun or from sources.
RunSnakeRun is a well rounded tool, easy to integrate - you can just use it with the stdlib cProfile/profile, just specify the filename argument to profile.run, eg:
import cProfile
cProfile.run("main()", filename="my.profile")
After that, run this in the shell:
runsnake my.profile
It looks like this:
This is acceptable and will work well if you don't have freakishly huge profiles, eg: you just have 1 function than takes too much time.
There's a memory profiling mode in RunSnakeRun (requires Meliae). To my shame I haven't tried it but it looks very useful if you want to visualize memory usage. It looks like this.
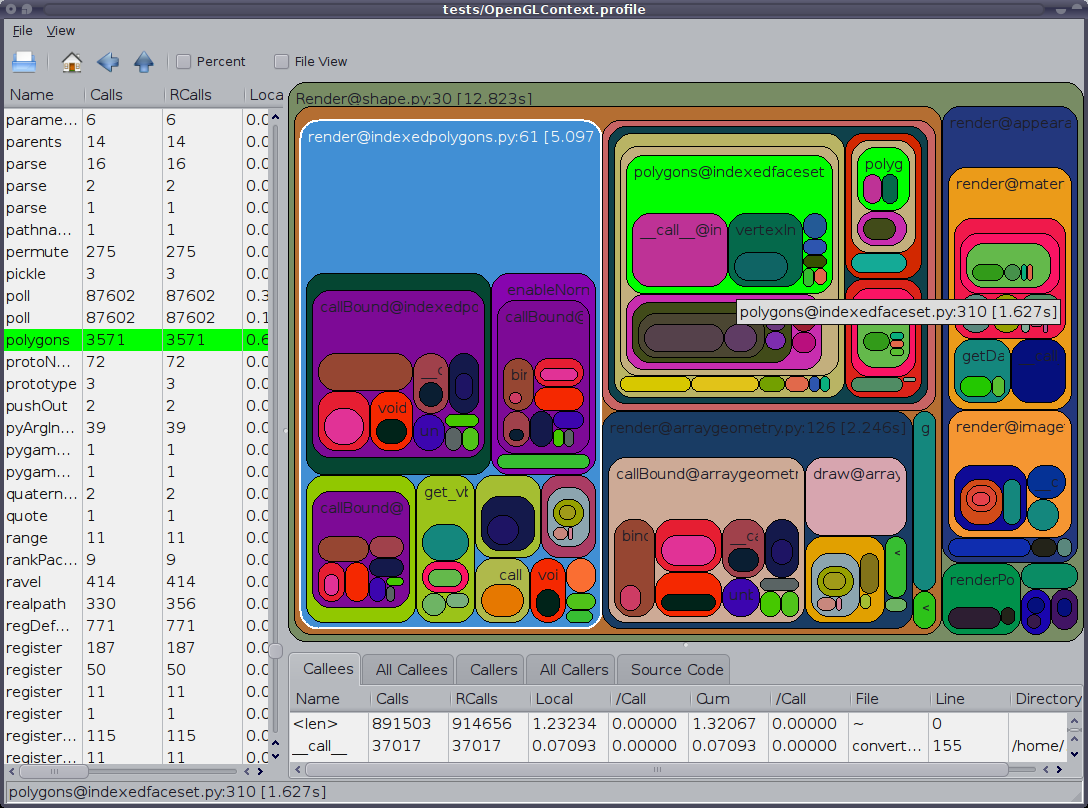
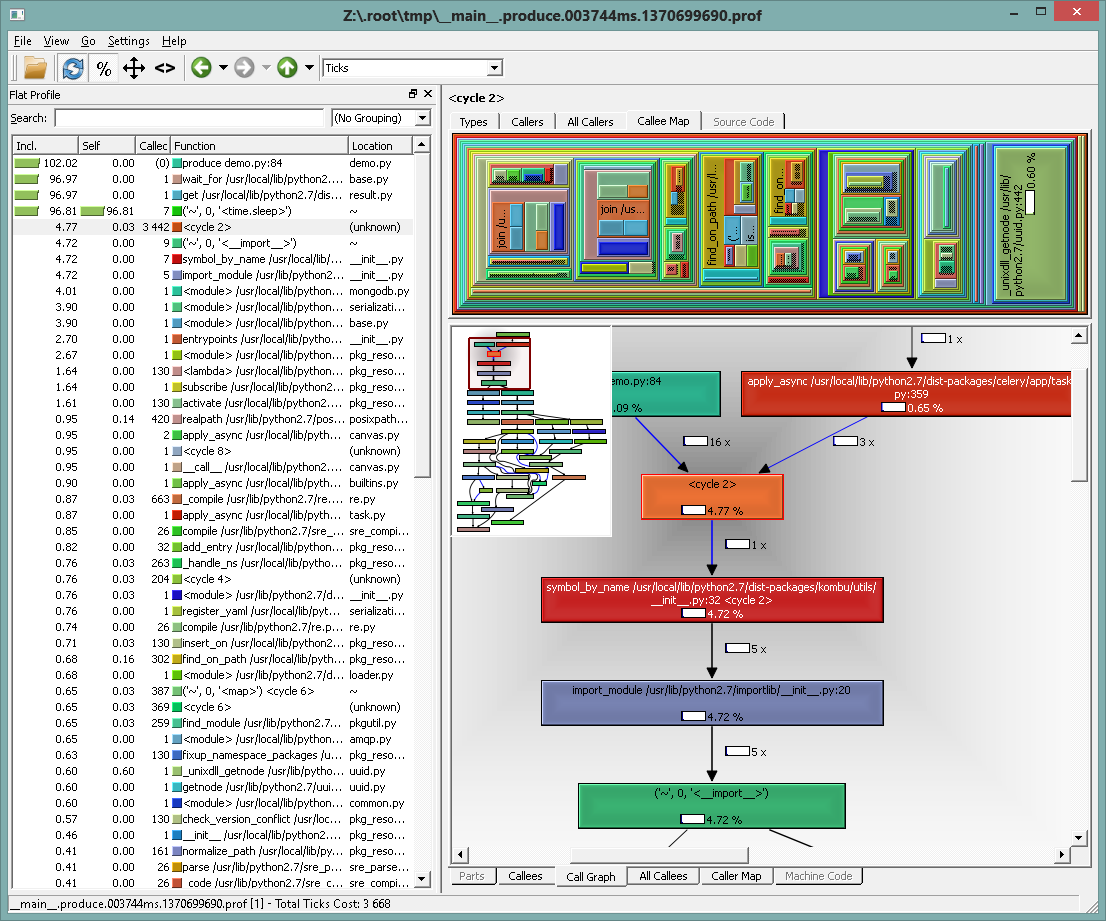
KCachegrind *
You can install it with with apt-get install kcachegrind or from sources. For windows you can use QCacheGrind.
I really like this tool! It shows you call tree graphs, sortable call tables, call/callee maps, sourcecode, and you can filter everything. It is language agnostic - you probably know this tool if you come from a C/C++ background.
I like this over RunSnakeRun cause it's a lot more powerful:
- on the call tree graphs: you can sort, change layout/rendering in many ways or export to dot/png - RunSnakeRun doesn't even show a call tree graph.
- you can see sourcecode
- you got callee maps
- it could be less pain to install it (no wxPython dependency)
KCachegrind is worth using using over RunSnakeRun in large projects where it's not obvious what needs attention or you generally have very many function involved.
Tools to generate KCachegrind profiles *
I guess this is the only downside, you need to export in this specific format. But it is well supported:
- pyprof2calltree
- django-extensions's runprofileserver
- this decorator
- kcachegrind-converters
- repoze.profile - just set the cachegrind_filename
- yappi
I'm using this function decorator that just litters your /tmp with profile dumps.
Obligatory screenshot:
―
Any other tools worth mentioning? Comment bellow!