So few days ago I had a very weird bug with an Apache httpd SSL terminator setup. So basically just a proxy to Nginx+uWSGI serving plain http. Do not ask why such a contrived setup, it's beyond reason.
Sometimes httpd would give this sort of error and big file uploads:
[proxy:error] [pid 18:tid 140393219815168] (32)Broken pipe: [client 10.0.2.2:55239] AH01084: pass request body failed to 172.21.0.9:80 (web), referer: https://localhost/upload/
[proxy_http:error] [pid 18:tid 140393219815168] [client 10.0.2.2:55239] AH01097: pass request body failed to 172.21.0.9:80 (web) from 10.0.2.2 (), referer: https://localhost/upload/
Trying few requests locally didn't reproduce the problem.
Not considering it only happened with large files I suspected there's some sort of boundary or timeout that is being hit. Firefox has a slow connection simulator in its Web Developer tools. Open up Responsive Design Mode and there are the throttling settings:
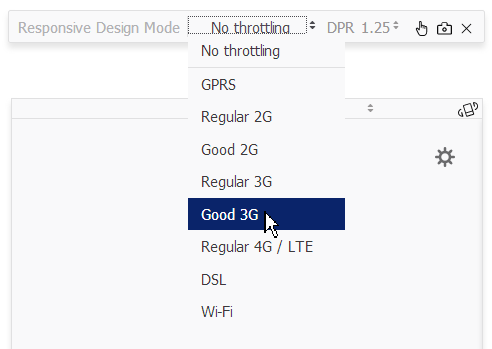
Note the funny "Good 3G" choice. As if someone would say "good devils" or "nice jerks".
Fortunately for me this reproduced the problem, and after few tries it turned out it reproduced with small files. So not a boundary, but a timeout problem.
Now I've tried to no avail making various Nginx settings like:
proxy_read_timeout 600s;
client_body_timeout 600s;
client_header_timeout 600s;
send_timeout 600s;
And in the Apache conf:
ProxyTimeout 600
So basically playing with this settings was a bit of shotgun debugging. Time to get serious and break out sysdig:
sysdig container.name=app_ssl_1 or container.name=app_web_1 -A -s 1000 > log
- I had two containers, thus the container.name filters. If you don't have containers then probably you'll want to filter by process name, as the output is already very verbose.
- The -A (or --print-ascii) is to strip non-ascii stuff from output.
- The -s 1000 is to see 1000 bytes from the various string being passed around.
So at this point I have a 30mb log file. Grepping [1] backwards through the output for close or connections seems like a good start. It turned out:
21:48:04.525468894 2 httpd (17039) < close res=0
21:48:04.525577726 2 httpd (17039) > close fd=10(<f>/tmp/modproxy.tmp.pmo53y)
21:48:04.525578150 2 httpd (17039) < close res=0
21:48:09.498690963 1 httpd (17064) > close fd=11(<4t>10.0.2.2:58997->172.21.0.8:443)
21:48:09.498691856 1 httpd (17064) < close res=0
21:48:46.935441278 1 nginx (25919) > close fd=18(<4t>172.21.0.8:35834->172.21.0.9:80)
21:48:46.935442465 1 nginx (25919) < close res=0
So basically Apache closing some weird file and then the ssl socket. Then Nginx closes connection from Apache. Not very helpful. At least I know from what port Apache connects to Nginx so I'll grep for :35834? Turns out this is a bogus connection, not my POST file upload. When looking at syscalls it's very important to not get bogged down in irrelevant details.
So now I search backwards for POST /upload. This has turned out something very promising:
21:48:04.525366305 2 httpd (17039) > writev fd=13(<4t>172.21.0.8:35836->172.21.0.9:80) size=882
21:48:04.525401643 2 httpd (17039) < writev res=882 data=
POST /upload/ HTTP/1.1
Host: web
User-Agent: Mozilla/5.0 (Windows NT 6.1; Win64; x64; rv:58.0) Gecko/20100101 Firefox/58.0
Accept: text/html,application/xhtml+xml,application/xml;q=0.9,*/*;q=0.8
Accept-Language: en-US,en;q=0.5
Accept-Encoding: gzip, deflate, br
Referer: https://localhost/upload/
Content-Type: multipart/form-data; boundary=---------------------------156582199825391
Cookie: ...
Upgrade-Insecure-Requests: 1
Pragma: no-cache
Cache-Control: no-cache
X-Forwarded-For: 10.0.2.2
X-Forwarded-Host: localhost
X-Forwarded-Server: localhost

21:48:04.525407958 2 httpd (17039) > mmap addr=0 length=4194304 prot=1(PROT_READ) flags=1(MAP_SHARED) fd=10(<f>/tmp/modproxy.tmp.pmo53y) offset=0
21:48:04.525417756 2 httpd (17039) < mmap res=7FE14C0AF000 vm_size=770340 vm_rss=14720 vm_swap=0
21:48:04.525420158 2 httpd (17039) > mmap addr=0 length=3093534 prot=1(PROT_READ) flags=1(MAP_SHARED) fd=10(<f>/tmp/modproxy.tmp.pmo53y) offset=4194304
21:48:04.525422012 2 httpd (17039) < mmap res=7FE13E4F9000 vm_size=773364 vm_rss=14720 vm_swap=0
21:48:04.525422762 2 httpd (17039) > writev fd=13(<4t>172.21.0.8:35836->172.21.0.9:80) size=7304273
21:48:04.525424849 2 httpd (17039) < writev res=-32(EPIPE) data=
Connection: Keep-Alive
Content-Length: 7304222

-----------------------------156582199825391
... tons of form data ...
Very interesting, the writev syscall error matches the initial error I've seen in the Apache logs (Broken pipe: [client 10.0.2.2:55239] AH01084: pass request body failed to 172.21.0.9:80). Can't be a simple coincidence.
So at this point it makes sense to look at the whole lifecycle of fd=13(<4t>172.21.0.8:35836->172.21.0.9:80). Now because FDs can easily have collisions (they get recycled, other processes can have a FD with same number) it's easier to just grep for the host and port (172.21.0.8:35836):
21:46:45.783868277 0 nginx (25919) > sendfile out_fd=19(<4t>172.21.0.8:35836->172.21.0.9:80) in_fd=20(<f>/var/app/static/bower_components/jquery-ui/themes/smoothness/images/ui-icons_cd0a0a_256x240.png) offset=0 size=4599
21:46:45.783927701 0 nginx (25919) > recvfrom fd=19(<4t>172.21.0.8:35836->172.21.0.9:80) size=1024
21:46:45.783936625 0 httpd (17039) > read fd=13(<4t>172.21.0.8:35836->172.21.0.9:80) size=8000
21:46:45.790029511 0 httpd (17039) > writev fd=13(<4t>172.21.0.8:35836->172.21.0.9:80) size=843
21:46:45.790072392 0 httpd (17039) > read fd=13(<4t>172.21.0.8:35836->172.21.0.9:80) size=8000
21:46:45.790090824 0 nginx (25919) > recvfrom fd=19(<4t>172.21.0.8:35836->172.21.0.9:80) size=1024
21:46:45.790214052 0 nginx (25919) > writev fd=19(<4t>172.21.0.8:35836->172.21.0.9:80) size=323
21:46:45.790219039 0 nginx (25919) > sendfile out_fd=19(<4t>172.21.0.8:35836->172.21.0.9:80) in_fd=20(<f>/var/app/static/bower_components/jquery-ui/themes/smoothness/images/ui-icons_888888_256x240.png) offset=0 size=7092
21:46:45.790298595 0 nginx (25919) > recvfrom fd=19(<4t>172.21.0.8:35836->172.21.0.9:80) size=1024
21:46:45.790309355 0 httpd (17039) > read fd=13(<4t>172.21.0.8:35836->172.21.0.9:80) size=8000
21:47:50.791539134 0 nginx (25919) > close fd=19(<4t>172.21.0.8:35836->172.21.0.9:80)
21:48:04.525366305 2 httpd (17039) > writev fd=13(<4t>172.21.0.8:35836->172.21.0.9:80) size=882
21:48:04.525422762 2 httpd (17039) > writev fd=13(<4t>172.21.0.8:35836->172.21.0.9:80) size=7304273
21:48:04.525467926 2 httpd (17039) > close fd=13(<4t>172.21.0.8:35836->172.21.0.9:80)
So two things to learn from this:
Nginx suddenly decides to close connection after 65 seconds. Note that it closes connection before Apache tries to send the request.
21:46:45.790298595 0 nginx (25919) > recvfrom fd=19(<4t>172.21.0.8:35836->172.21.0.9:80) size=1024
21:47:50.791539134 0 nginx (25919) > close fd=19(<4t>172.21.0.8:35836->172.21.0.9:80)
21:48:04.525366305 2 httpd (17039) > writev fd=13(<4t>172.21.0.8:35836->172.21.0.9:80) size=882
21:48:04.525422762 2 httpd (17039) > writev fd=13(<4t>172.21.0.8:35836->172.21.0.9:80) size=7304273
21:48:04.525467926 2 httpd (17039) > close fd=13(<4t>172.21.0.8:35836->172.21.0.9:80)
Apache will do two writes before realising connection is busted, something is funny there (looks like a bug, or some unrelenting optimization).
Apache is pipelining the proxied requests (note the sendfile for static files). Basically multiple HTTP requests and responses are sent/received on the same connection - an often tricky feature of HTTP 1.1.
So now, a wtf-moment.
In a situation like this the only way forward is to peel layers from the onion: remove code, disable components etc.
Since mod_ssl is the most annoying component around (we don't see any meaningful data in the sysdig logs because it's encrypted) we could try to disable that first. Easy enough, just comment out the SSL stuff and leave the port:
<VirtualHost *:443>
     # SSLEngine On
     # SSLCertificateFile ...
     # SSLCertificateKeyFile ...
     ...
Now we can send plain HTTP test requests to http://localhost:443/. It works why wouldn't it, and it also reproduces the problem.
Digging again in the logs (grep for POST /upload) yields:
09:22:24.700375109 0 httpd (653) > read fd=10(<4t>10.0.2.2:57454->172.20.0.6:443) size=8000
09:22:24.700381289 0 httpd (653) < read res=1460 data=
POST /upload/ HTTP/1.1
Host: localhost:443
User-Agent: Mozilla/5.0 (Windows NT 6.1; Win64; x64; rv:59.0) Gecko/20100101 Firefox/59.0
Accept: text/html,application/xhtml+xml,application/xml;q=0.9,*/*;q=0.8
Accept-Language: en-US,en;q=0.5
Accept-Encoding: gzip, deflate
Referer: http://localhost:443/upload/
Content-Type: multipart/form-data; boundary=---------------------------8182195208398
Content-Length: 8243581
Cookie: csrftoken=...
Connection: keep-alive
Upgrade-Insecure-Requests: 1
Pragma: no-cache
Cache-Control: no-cache

-----------------------------8182195208398
...
150926 09:22:24.700635979 0 httpd (653) > read fd=10(<4t>10.0.2.2:57454->172.20.0.6:443) size=8000
150927 09:22:24.700638437 0 httpd (653) < read res=-11(EAGAIN) data=
150928 09:22:24.700642986 0 httpd (653) > read fd=10(<4t>10.0.2.2:57454->172.20.0.6:443) size=8000
150929 09:22:24.700644098 0 httpd (653) < read res=-11(EAGAIN) data=
150930 09:22:24.700645959 0 httpd (653) > poll fds=10:41 timeout=20875
Note the funny two subsequent reads failing with EAGAIN - another unrelenting optimization?
And some time later (depending on throttling settings) Apache decides it's time to send the headers:
09:23:49.386532541 3 httpd (653) > writev fd=11(<4t>172.20.0.6:56980->172.20.0.5:80) size=1132
09:23:49.386624313 3 httpd (653) < writev res=1132 data=
POST /upload/ HTTP/1.1
Host: web
User-Agent: Mozilla/5.0 (Windows NT 6.1; Win64; x64; rv:59.0) Gecko/20100101 Firefox/59.0
Accept: text/html,application/xhtml+xml,application/xml;q=0.9,*/*;q=0.8
Accept-Language: en-US,en;q=0.5
Accept-Encoding: gzip, deflate
Referer: http://localhost:443/upload/
Content-Type: multipart/form-data; boundary=---------------------------8182195208398
Cookie: csrftoken=...
Upgrade-Insecure-Requests: 1
Pragma: no-cache
Cache-Control: no-cache
Proxy-Secret: 17610e1815bed35364ea65a8c723e10101b64e0c2e824fca6f67eb120b7b7fc6
X-Forwarded-For: 10.0.2.2
X-Forwarded-Host: localhost:443
X-Forwarded-Server: localhost

09:23:49.386660855 3 httpd (653) > writev fd=11(<4t>172.20.0.6:56980->172.20.0.5:80) size=8243632
09:23:49.386664671 3 httpd (653) < writev res=-32(EPIPE) data=
So basically what happens here is that out keepalive connection times out. Turns out there was a Nginx setting for this, the default being:
keepalive_timeout 75s;
Now you don't really want to increase that, you'd end up with lots of tied up sockets and fds in dead connections.
So the mystery remains: why does Apache only send out the request after buffering the whole request body?
Unfortunately this is only clarified by looking at the not exactly short mod_proxy documentation. The fix ...
SetEnv proxy-sendchunked
And now I wasted your time too 👿
| [1] | Pro tip: use rg instead of grep. You probably know the impressive silversearcher (ag) but https://github.com/BurntSushi/ripgrep buries everything else. However, having the output already in a smallish file I've just used less. Just press / (search) or > (jump to end) and ? (search backwards) and fire way your regex. |